
01
Wide pass
Satellite and public aerial imagery, including NAIP, rank the territory so we are not guessing which feeders deserve a closer look.
 Moscow, Idaho
Trees grow into lines and fall onto them. Trim cycles still walk the corridor on a schedule. We turn imagery into a ranked work list for Inland Northwest co-op feeders so your crews hit the miles that matter most.
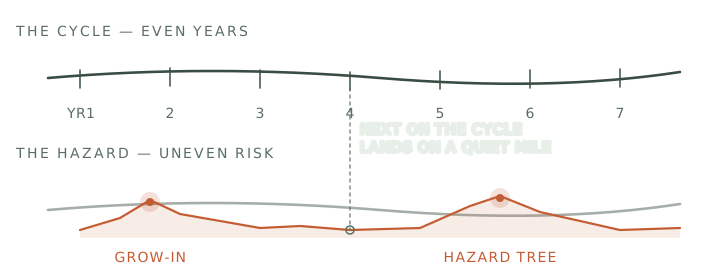
On wooded feeders, vegetation into the wire and hazard trees outside the right-of-way cause a lot of blinks and outages. Most programs still clear miles on a fixed multi-year cycle. The hazard does not wait for its turn.
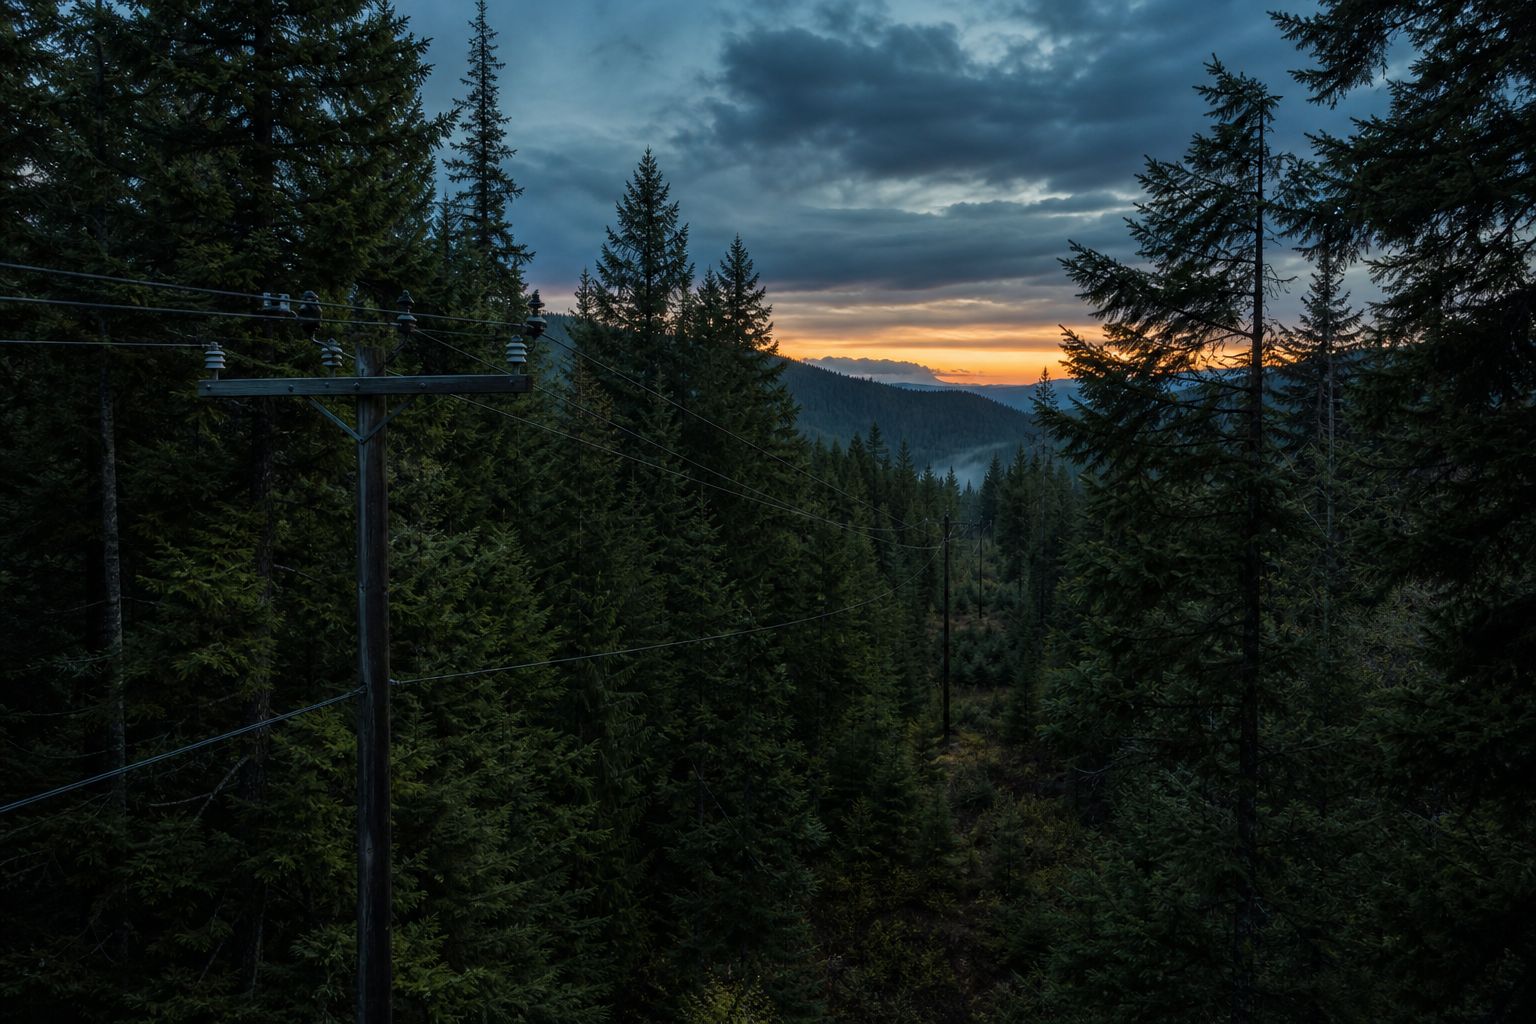
Growth into the conductors, or trees and limbs outside the ROW that can strike a span.
The trim budget is set by the calendar, not the risk. A cycle that runs six or seven years covers a lot of ground fine, but it spends the same crew hours on quiet spans while the worst miles wait their turn.
After wind, ice, or fire, you need a clear picture of which spans moved or failed before you send trucks.
The same ranked view helps when you are deciding where to harden first for wildfire season.
Satellite shows where to look. Then we spend cheap miles first: a camera on the vehicle covers everything you can drive. The drone only flies the spans the vehicle cannot reach. Every mile earns its place on the list before you spend a crew day on it.
Satellite and public aerial imagery, including NAIP, rank the territory so we are not guessing which feeders deserve a closer look.
For the drivable corridor, we drive it. Road-level capture confirms lean, encroachment, and storm damage at a pace a vehicle can keep — most of the feeder, without burning flight time.
Where the wire leaves the road, a licensed drone flight fills the gap. You get one GIS-ready work list: highest-risk miles first, with a view for each span your people can check.
From you: priority feeders and a centerline export. If that is not ready, we can start from public NAIP under an NDA.
Jim Coleman · Moscow, Idaho — remote sensing, GIS, and field capture for Inland Northwest co-ops.


 Ranked work list (CSV and GeoJSON)
 Map package for the web or for QGIS / Arc
 Short methods note and a 90-minute review workshop
 Optional help with grant language for wildfire or resiliency applications